2021 Brooklyn Sales Market Review
Fahgettaboudit. Or at least that is what you can do when comparing the volume of residential sales for Brooklyn in 2021 against past years. Linecity looked at the end-of-year numbers for the sale of apartments (condos and co-ops) and 2021 stands alone, far outdistancing previous highs.
The number of sales as well as the total dollar volume flew by the 2020 numbers while setting new marks in almost every category of tracked sales. The average price of a Brooklyn apartment also climbed, edging toward one million dollars.
Total sales volume for condos and co-ops in Brooklyn in 2021 climbed toward $8.5 billion, a 98% jump from last year’s depressed total of $4.288 billion and a 53% hike from the $4.764 billion sold in 2019. The 2021 numbers reflect a 47% increase over the $5.761 billion sold in 2017, the previous high watermark.
Correspondingly, the number of recorded sales in 2021 climbed to 8,745, a 74% jump from the 2020 total of 5,014. The previous high mark was 6,594 sales in 2017.
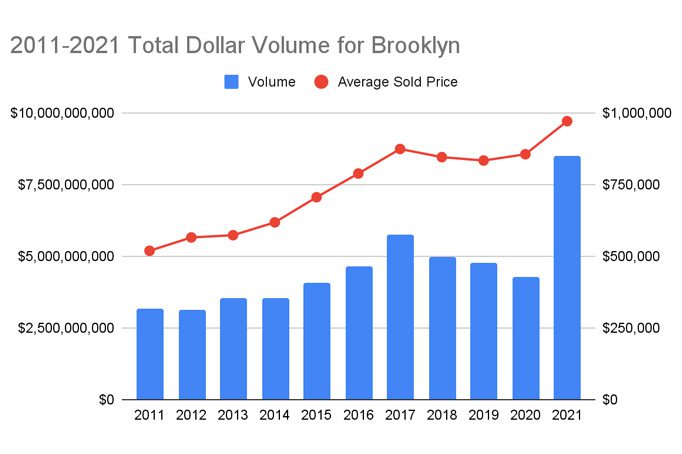
Sure Covid has played a role in elevating the numbers from 2020 to 2021, but at the same time the volume of sales and the total dollar volume is off the charts.
What are the reasons for the surge? There are many. Pent-up supply from 2020 when the market virtually shut down for a large portion of the year. Due to the oversupply, buyers descended upon the market and scored deals; the oversupply naturally pushed down prices. There was a backlog of signed contracts from 2020 that failed to close due to covid inflicted limitations in the closing process; all of these sales were shifted to 2021. Interest rates have continued at historic lows. A surging stock market created a lot of new wealth, some of which was re-invested in real estate. New and exciting opportunities in Brooklyn for condo buyers; literally the door has opened for new buyers that may have never considered Brooklyn as a home or for an investment.
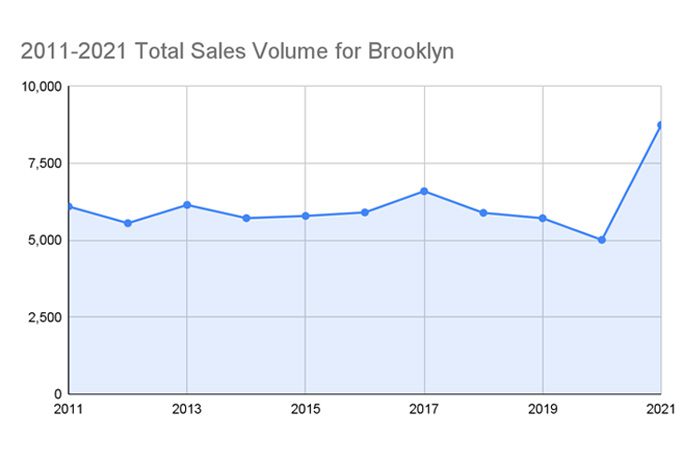
Even if we compare the 2021 numbers to 2019, the increase in the number of sales and the jolt in sales volume for Brooklyn is staggering. From 2011 to 2019, Brooklyn averaged 5,936 apartment sales per calendar year. In 2019 there were 5,716 recorded sales, a number pretty much on par with the yearly figures over the past decade. The 8,745 sales in 2021 represented a 53% jump from the number of sales in 2019.
However, it’s the dollar volume of sales that is a real eye opener. Again, if we go back two years to 2019, the 2021 totals far distanced any of the pre-covid years. The $8.489 billion worth of apartments that were sold in 2021 represented a 78% increase over 2019 when $4.764 billion were sold. The average volume of sales from 2011 through 2019 was $4.179 billion, less than half the total volume in 2021.
Let’s now look at condominium sales as its own category. In 2021, the total value of condo sales was $6.328 billion, approximately 75% of the total sales (co-ops and condos) volume. According to city records, there have been 5,613 condos sold at an average price of $1.217,404. The average size of a closed condo was 1,119 square feet with an average price per square foot of $1,050. The number of condos sold represents an 87% increase over the 3,003 condos sold in 2020 and a 107% increase in dollar volume as volume increased from $3.06 billion to a shade above $6.328 billion.
When comparing 2021 to 2019, the numbers of sales grew from 3,430 to 5,613, an increase of 63.6%. The sales volume during the same period grew by $2.8 billion, an increase of more than 80%.

More than 45% of the condo sales in 2021 reflect a new development sale. In 2021 there were 2,573 new development condos sold compared to the 1,313 sold in 2020, a 96% increase. The dollar volume of new development condos sold rose from $1.423 billion to $3.142 billion, a staggering 121% increase. The average price of a new development purchase was north of $1.22 million with an average price per square foot of $1,129. The average size of a new development sale was 1,110 square feet.
To draw an historical comparison, the average number of yearly sales for the nine-year period extending from 2011 through 2019 was 1,230. The volume of Brooklyn’s new development sales for the same period averaged $1.208 billion.
Looking at co-op sales, 2021 has been equally as impressive. The number of sales in 2021 totaled 3,132 units, a 56% increase over the 2,011 co-ops sold in 2020. In 2019 just 2,286 co-op apartments were sold. Prior to 2021, the most co-ops sold was in 2013 when 2,870 apartments transferred. If we look at dollar volume alone, 2021 is in a class by itself with more than $2.161 billion of co-op sales. This is a 76% increase over the $1.229 billion sold in 2020 and a 73% increase over $1.246 billion sold in 2019. When comparing these numbers to co-op sales volume over the past decade, it surpasses the closest year, 2017, by $832 million.

The average price of a co-op in 2021 was $690,063. While our square footage numbers on co-ops are incomplete, we approximate the average size of a sold co-op to be about 928 square feet with an average price per square foot to be about $711.
The $690,063 average co-op price represents a 13% increase over the $611,552 average price from 2020. When compared to 2019, the increase in average price grew by 27% from $545.022.